
My Garmin can divide a run into five tidy coloured zones. That doesn’t mean the colours arrived on stone tablets.
At 68, I’ve become a late-blooming running-data nerd. I like the graphs, the splits and the detective story hiding inside a Garmin FIT file. I also like running. The data are a fascinating second layer of the experience, not a judge deciding whether I had a worthwhile morning.
That distinction matters with heart-rate zones. A watch can make a boundary look exact down to one beat per minute. The confidence of the display can be much greater than the confidence of the evidence underneath it.
During my BlackToe Holiday 10K rebuild, I wanted zones that were more useful than a generic age formula without pretending that one field test carried the authority of a laboratory assessment. I used CoachChat to build a provisional set from one structured field baseline, then checked it against ordinary runs, RPE, breathing, recovery and sensor quality.
I call them provisional because they guide my training while remaining open to revision. They don’t get to overrule the runner.
Why Heart Rate Zones for Runners Over 50 Are Suddenly Everywhere
Heart-rate training isn’t new, but wearables have made it unavoidable. A recent Runner’s World guide to heart-rate zones walks readers through five-zone models, laboratory testing, field testing and the factors that can move heart rate from day to day. Another Runner’s World account of a runner whose laboratory testing changed the zone picture shows why a default formula can feel wrong even when the runner is doing an easy run.
The search question is often some version of, “What should my Zone 2 be at my age?” I understand the appeal. Give me my age, produce the number, and let me get out the door.
The trouble is that age-predicted maximum heart rate is a population estimate. The American Heart Association’s target-heart-rate chart describes its figures as averages and notes that some medications can affect heart rate. Garmin’s zone guide also allows custom and activity-specific zones, and some devices can use lactate-threshold information.
Age matters. It just doesn’t know enough by itself. Two runners who are both 68 can have different training histories, health considerations, medications, measured maximum heart rates, thresholds and responses to heat. “Over 50” describes an audience, not one cardiovascular setting.
I Didn’t Start With 220 Minus My Age
My working maximum heart rate was already 180 bpm from earlier running evidence. The BlackToe baseline wasn’t designed to prove that maximum or locate a laboratory threshold. Its narrower job was to find the heart-rate neighbourhood that matched genuinely easy aerobic running during my current rebuild.
The right question wasn’t, “How high can I make the number?” It was, “What does controlled running look like right now?”
I’ve written before about Why I Like (Low) Heart Rate Training. I still like the restraint it can encourage. But I don’t think low-heart-rate training means obeying a formula that makes conversational running look suspicious simply because the runner has had another birthday.
TrainingPeaks explains threshold testing as a way to establish zones from an athlete’s own response, while also acknowledging that field tests estimate rather than duplicate a laboratory assessment. My test was gentler and aimed at the easy end of training, not a threshold test. That difference belongs in the record.
My BlackToe Heart-Rate Baseline
The baseline was completed on August 22, 2026, in 17°C weather with 89 percent humidity. Heart rate came from a chest strap. I was fresh and ready to go. A small posterior-tibialis sensation eased before the main work and pain was zero afterward.
The seven-part session was deliberately simple:
- 5 minutes brisk walking
- 5 minutes very easy jogging at RPE 2 to 3
- 10 minutes at 135 to 145 bpm
- 10 minutes at 145 to 150 bpm
- 5 minutes at RPE 3 to 4 with the heart-rate display hidden
- 2 minutes very slow recovery walking
- 5 minutes easy cooldown walking
The hidden-display section was the key. After 25 minutes of work, I ran by feel. I kept nose-only breathing, judged the effort as RPE 3 to 4 and didn’t feel compelled to force the pace. When the data were reviewed later, that section had settled at about 147 bpm average, peaked around 151 and ran at roughly 8:11 per kilometre.
That wasn’t a magic number appearing from nowhere. It was convergence.
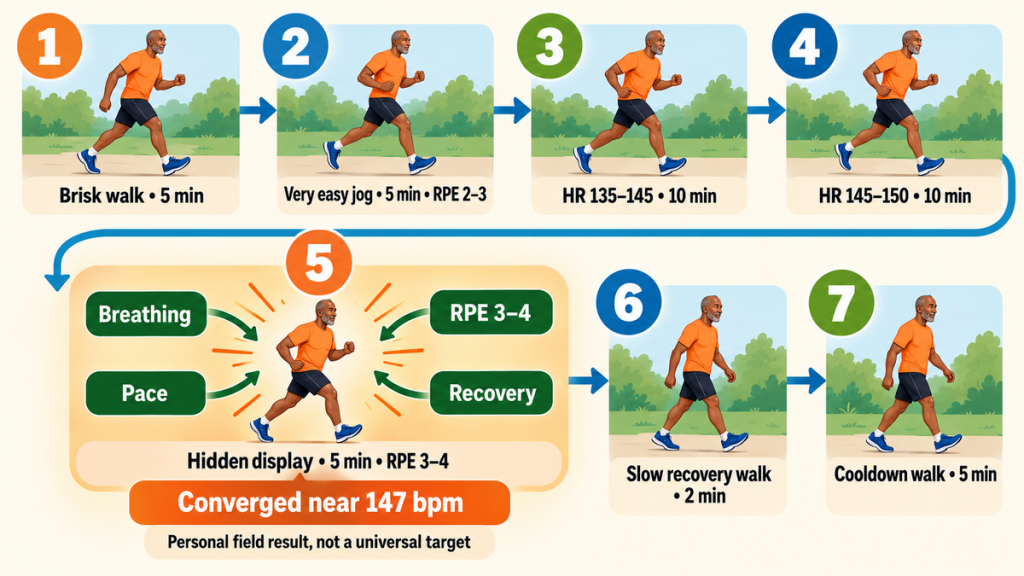
Perceived effort, breathing, heart rate, pace behaviour and the post-run recovery all told roughly the same story.
TrainingPeaks’ overview of RPE and subjective feedback makes a useful distinction: perceived exertion describes intensity, while subjective feeling captures how the athlete feels more broadly. I need both. “RPE 4” and “my breathing was controlled, my stride felt easy and the discomfort faded” are related, but they aren’t identical information.
The Provisional Zones We Entered
After the baseline and a normal-world validation run, CoachChat created one shared language for Garmin, Strava and the Plus50Fit analysis:
- Zone 1, recovery or very easy: up to 129 bpm
- Zone 2, easy aerobic: 130 to 149 bpm
- Zone 3, steady or moderate: 150 to 159 bpm
- Zone 4, threshold-oriented or hard: 160 to 169 bpm
- Zone 5, very hard or high intensity: 170 to 180 bpm
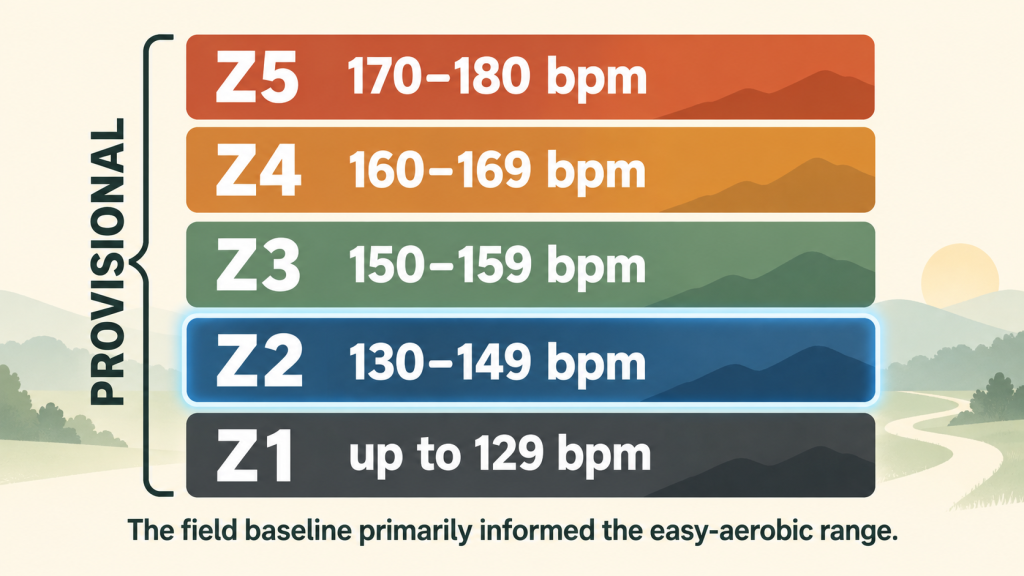
These ranges aren’t a claim that every beat inside a colour produces a unique training effect. They’re working boundaries for this training block.
The baseline mainly informed the easy-aerobic area. It didn’t retest my true maximum heart rate, prove lactate threshold or justify hard running during an early rebuild. The upper zones retained prior working boundaries and were reserved for later training.
My Training Metrics Made Simple guide explains what the common numbers mean. This experiment asks the next question: when should I believe them?
One Ordinary Run Helped, Then a Bad Strap Taught the Better Lesson
A week later, I completed a 45-minute easy-endurance run in 19°C weather and 89 percent humidity. The useful 35-minute running body sat mostly around 141 to 143 bpm. RPE matched the prescribed 4, cadence stayed stable, the session finished under control and pain was zero afterward.
That supported the provisional Zone 2 range. It still didn’t make the range permanent.
Then Week 4 supplied the useful complication. On one run, my chest strap began implausibly low, jumped high, lost connection and only later settled. The whole-session average was 131 bpm. It looked wonderfully economical. It was also built partly from nonsense.
CoachChat didn’t revise my zones. It leaned on the evidence that remained credible: RPE 3 to 4, complete nose breathing, stable cadence, pace behaviour and a symptom that didn’t worsen. I told that story in What Strava Missed About My Run.
The lesson wasn’t that subjective feeling always defeats technology. It was that a suspect sensor doesn’t become trustworthy because it produced an average. Good mathematics can still summarize bad input.
Why My Zone 2 May Look High for 68
At 68, an easy-aerobic range extending into the high 140s may look suspicious if you begin with an age-based formula. But this isn’t the first time my running has pointed toward that range.
On May 17, 2025, I completed a treadmill lactate-threshold test at Body Insight Canada. My LT1, the aerobic threshold they used as the upper boundary of Zone 2, occurred at 147 bpm. The test placed my Zone 2 between 136 and 147 bpm.
Sixteen months later, the hidden-display section of my BlackToe field baseline also converged near 147 bpm through the combined evidence of heart rate, RPE, breathing and recovery.
That doesn’t make the new zones permanent or prove that nothing has changed. It does mean the present result agrees with earlier lab evidence and deserves to be tested rather than dismissed because it looks high for my age.
My Zone 2 may look high for my age. The important question isn’t whether it matches a formula. It’s whether it matches my physiology.
How I Actually Use the Zones While Running
For easy and endurance running, RPE and breathing drive the train. Heart rate is the signal.
I begin with the workout purpose. If the assignment is RPE 3 to 4, I want relaxed mechanics, controlled breathing and enough conversational ease to confirm that I’m not quietly turning the run into a test.
Heart rate then provides a guardrail. If it climbs unusually high for the pace and feel, I can slow down, walk, check the heat, consider fatigue or inspect the sensor. If it looks implausibly low while pace and cadence say I’m clearly running, I don’t speed up to satisfy a faulty number.
Pace is allowed to be the result. Hills, humidity, wind, sleep and accumulated fatigue can change the pace produced at the same internal effort. That’s why my AI running coach experiment keeps the prescription, Garmin evidence, runner context and post-run assessment connected.
My post-run debrief prompt makes me record the things the watch can’t know: sleep, weather, terrain, discomfort, breathing, walks, interruptions and what the run actually felt like. The watch supplies evidence. I supply testimony. CoachChat has to keep the two sources separate.
What AI Added, and What It Couldn’t Measure
AI didn’t measure my physiology. It didn’t place a mask on my face, sample blood lactate, examine me or turn a field run into a clinical test.
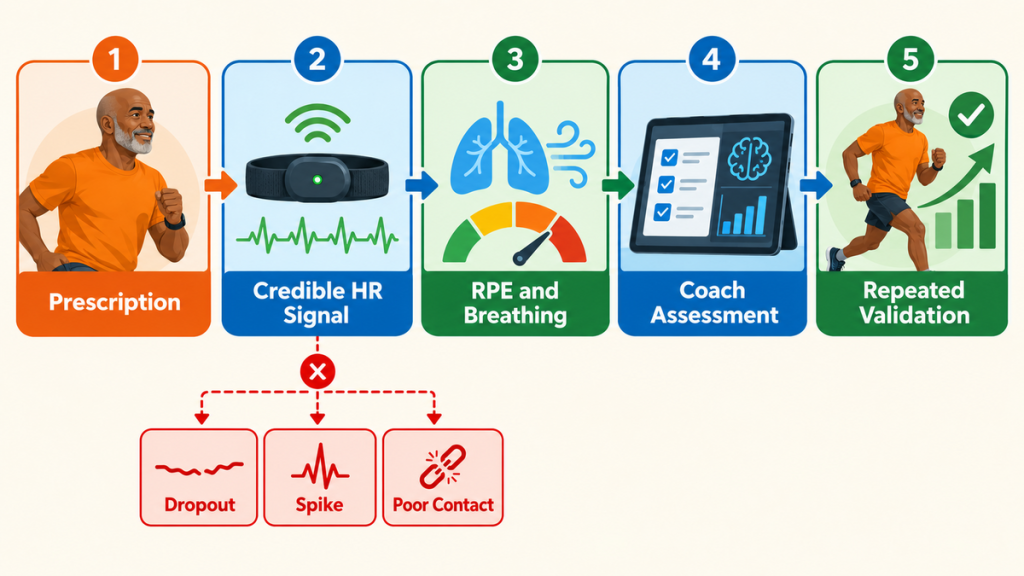
What it added was organization and memory. It could compare the prescription with the FIT evidence, keep my comments beside the graphs, distinguish an easy-run baseline from a threshold test and refuse to change the plan when bad data didn’t justify a change.
That restraint is part of my smallest-sensible-change rule. A coach, artificial or otherwise, shouldn’t rebuild a training system every time one number looks interesting.
The larger transparent chain remains:
Coach prescription → Garmin FIT evidence → runner context → post-run assessment → multi-run trend comparison
My current Plus50Fit FIT Tool and Run Compare applications help me preserve that chain on my own Windows computer. The experiment may eventually produce free downloadable tools readers can try, with local FIT processing and sample files. That’s a possibility, not a release promise. Testing, installation, privacy, digital signing, support and future Mac questions are still unresolved.
My Five Rules for Using Heart-Rate Zones After 50
1. Start With the Best Evidence You Actually Have
A laboratory assessment may provide the clearest individual picture. A suitable field test, recent race evidence or device estimate may be more practical. What matters is naming the source and its limits.
2. Cross-Check the Number Against the Runner
RPE, breathing, talk test, mechanics and recovery don’t make heart rate irrelevant. They help tell me whether the number fits the experience.
3. Inspect the Signal Before Interpreting the Physiology
Dropouts, spikes, poor strap contact and motion artefacts can manufacture a persuasive average. If the trace is bad, the conclusion has to shrink.
4. Change Zones From Repeated Evidence, Not One Flattering Run
One workout can reveal a problem. A zone revision usually deserves clean, repeated evidence under reasonably comparable conditions.
5. Keep Medical Questions Out of the Prompt Box
The American Heart Association notes that medications can affect heart rate. Health history, symptoms and medication effects belong in conversations with an appropriate healthcare professional. AI can help organize what happened. It can’t diagnose why it happened.
Frequently Asked Questions
Does 220 Minus Age Give Accurate Running Heart-Rate Zones?
It gives an age-based estimate of maximum heart rate, not a personal measurement. It can be a starting point when nothing better is available, but it may not match an individual runner’s actual maximum, thresholds or easy-running response.
Should Older Runners Automatically Train at Lower Heart Rates?
Not from age alone. Training history, health, medications, tested or observed maximum heart rate, workout purpose and current conditioning all matter. The safer conclusion is that older runners should use appropriately individualized guidance, not that every birthday requires the same numerical reduction.
Can AI Set My Heart-Rate Zones?
AI can help organize a suitable test, compare recorded data with RPE and breathing, preserve chronology and propose provisional boundaries. It can’t perform a physical examination or turn incomplete data into a clinical measurement. Any AI suggestion is only as good as the evidence, instructions and safety limits around it.
What If My Easy-Run Heart Rate Looks Too High?
First respect how you feel. Slow down or walk if needed, especially if breathing, mechanics or symptoms are worsening. Then consider heat, hills, fatigue, hydration, stress, sensor quality and whether the zones themselves are reasonable. Unusual or concerning symptoms deserve qualified medical attention, not an argument with the watch.
The Zone Is a Guide, Not the Run
I like having heart-rate zones. They give my watch better context and give CoachChat a consistent language for comparing the plan with what happened.
I don’t think the value lies in keeping every easy-run heartbeat inside a perfect coloured stripe. The value lies in noticing when heart rate, effort, breathing, pace and symptoms agree, and becoming curious when they don’t.
My BlackToe zones are useful because they came from my running and survived several real-world checks. They remain provisional because I’m one runner in one changing training block, and because a device number should never become more certain than the evidence that produced it.
The runner still gets the final word.
AI Disclosure
I developed this article with AI assistance for current-source checking, search-intent review, structure and drafting. AI is also part of the coaching process being examined. The running experience, opinions, decisions and final editorial judgment are my own.
Safety Disclaimer
This article describes my personal N=1 running experiment and isn’t medical advice or an individualized training prescription. Heart rate can be affected by health conditions, medications, heat, illness, stress and sensor error. Consult an appropriate healthcare professional before changing exercise intensity if you have cardiovascular concerns, take medications that affect heart rate or experience chest discomfort, dizziness, fainting, unusual shortness of breath, palpitations or other concerning symptoms.