
I missed writing this Blue Nose 10K race debrief while the race was still fresh. In hindsight, the delay gave the data time to tell a cleaner story.
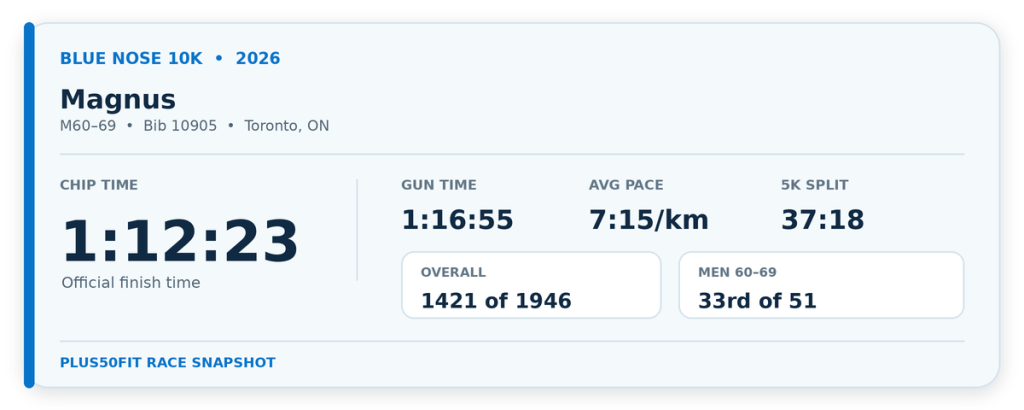
My 1:12:25 finish in Halifax was not the 10K I had originally planned. It came after an injury-managed build, roughly two weeks without running and a deliberate decision to stop chasing the marathon I had entered. The goal on May 17 was simple: begin conservatively, keep the race alive and see what I still had when the course finally allowed me to use it.
The answer arrived in the final kilometre: 6:10, an average heart rate of 177 bpm and my highest cadence of the race. It was by far my fastest kilometre of the day.
That finish does not erase the difficult middle kilometres or the lower-leg soreness that increased afterward. It does, however, change what the race means. This was not a failed attempt to hold an even pace. It was a managed effort that left me able to finish like a racer.
Blue Nose 10K Race Snapshot
| Race | Medavie Blue Nose 10K |
| Date and place | May 17, 2026 | Halifax, Nova Scotia |
| Finish | 1:12:25.5 for 10.019 km |
| Average pace | 7:14/km |
| Heart rate | 162 bpm average | 180 bpm maximum | chest strap |
| Conditions | 11°C, feels like 8°C | 80% humidity | SW wind 11.2 km/h |
| Shoes | Altra Experience Flow |
| Effort | RPE 8/10 |
| Lower-leg soreness | 2/10 before | 2/10 during | 4/10 after |
This Was Never a Normal 10K
The route to Halifax had already become an Ouch to 10K pivot. I had been preparing for the full Medavie Blue Nose Marathon, but a persistent lower-leg problem changed the assignment. By race week, the original 42.2-kilometre goal had become a carefully managed 10K after about two weeks without running.
However, that context matters. A finish time without the story around it can look like a verdict. This one was never a clean test of trained 10K potential. It was a test of judgment: could I resist the excitement of race morning, respect the leg, manage the hills and still put together a finish I could be proud of?
The official Blue Nose Marathon weekend gave me the stage. My job was to arrive at the far end of it without turning one difficult race into a longer setback.
The Plan: Keep the Race Alive
I did not carry a rigid kilometre-by-kilometre pace target. I wanted to start conservatively, let heart rate provide a boundary early and then run by feel. Walking was available as a strategy, not a sign that the day had gone wrong.
- Begin under control and refuse the usual early-race adrenaline bargain.
- Walk the first water station and the return bridge if that kept the effort manageable.
- Protect the lower leg and the race long enough to make an honest decision late.
That plan sounds simple when written afterward. On a race course, surrounded by people moving faster and with a watch offering constant temptation, restraint is work.
How the Kilometres Unfolded
The split table shows a race with three distinct movements: a controlled opening, two deliberate disruptions and a committed finish.
| KM | Pace | Avg HR | Cadence |
| 1 | 7:24/km | 146 | 164.8 |
| 2 | 7:00/km | 156 | 166.8 |
| 3 | 7:00/km | 158.5 | 167.8 |
| 4 | 6:50/km | 161 | 166.0 |
| 5 | 8:22/km | 158.7 | 150.7 |
| 6 | 7:15/km | 165.3 | 166.6 |
| 7 | 6:58/km | 164.2 | 167.2 |
| 8 | 8:01/km | 164.6 | 156.6 |
| 9 | 7:19/km | 171.3 | 163.4 |
| 10 | 6:10/km | 177.1 | 170.3 |
Source: Garmin FIT file processed retrospectively. Heart rate came from a chest strap.
The Opening Four Kilometres
The first four kilometres moved from 7:24 to 7:00, 7:00 and 6:50 per kilometre. Heart rate rose progressively from 146 to 161 bpm. That looks like settling into the race, not spending recklessly at the start.
I wanted conservative, and the data says I actually delivered it. That matters because race-day intention and race-day behaviour do not always recognize each other.
The Two Slow Kilometres Were Not Failures
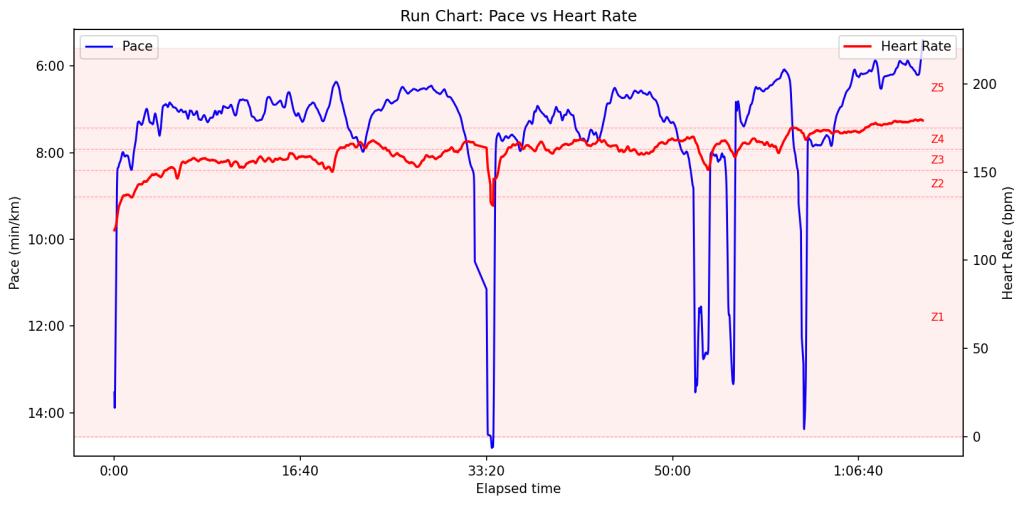
For example, kilometres five and eight stand out at 8:22 and 8:01 per kilometre. Cadence drops in both, which matches the walking and slowing recorded around the water station and bridge. If I looked only at the pace graph, I could call them collapses. The lived account says otherwise.
Walking was part of the plan. More importantly, I resumed running afterward. Cadence returned to the mid-to-high 160s in kilometres six and seven, and the race remained intact. Those slower splits were decisions inside the race, not evidence that the race had ended.
The Final Kilometre Changed the Story
The final 1 to 1.5 kilometres are what I remembered most clearly. I felt powerful, committed and proud of the way I finished. The FIT file supports that memory.
Kilometre nine took 7:19 at 171.3 bpm with a cadence of 163.4 spm. Kilometre ten dropped to 6:10 at 177.1 bpm, while cadence rose to 170.3 spm. That last kilometre was 69 seconds faster than kilometre nine and 40 seconds faster than any previous full kilometre in the race.
This was not just a brief sprint before the line. The continuous trace shows a sustained acceleration. Heart rate and cadence climbed with the pace, which tells me I was actively producing more effort rather than simply coasting down a favourable slope.
Could I have run faster earlier? Perhaps. But that is not the useful lesson. With limited preparation and a compromised lower leg, preserving enough physical and mental reserve to finish hard was a successful risk-management outcome.
What Heart Rate and Cadence Added
Because I wore a chest strap, I have relatively high confidence in the heart-rate trace. The pattern is reassuring: heart rate rose with the work and peaked late rather than surging out of control in the opening kilometres. An average of 162 bpm and maximum of 180 bpm also fit my reported RPE of 8/10. This was a genuine race effort.
Cadence was similarly stable whenever I was running. It sat near 165 to 168 spm through the opening four kilometres, returned to roughly 167 spm after the first walk section and reached 170.3 spm in the final kilometre. The low values in kilometres five and eight mostly record the strategic walks, not a gradual breakdown in turnover.
This is where Training Metrics Made Simple earns its name. Pace, heart rate and cadence are more useful together, but only when the human context stays attached.
What the Numbers Cannot Prove
However, the FIT processing reported 296 metres of accumulated ascent and 288 metres of descent. I do not treat that as a verified statement of the course’s total climb. The route felt demanding and the bridge felt steeper than the simple course profile suggested, but device elevation and post-processing can introduce enough uncertainty that the exact number deserves caution.
I also would not use this race for a conventional aerobic-drift or decoupling calculation. Hills, warm-up effects, deliberate walks and the late acceleration break the assumptions needed for a clean steady-state comparison. A metric is not automatically meaningful simply because software can calculate it.
The Cost After the Finish
My lower-leg discomfort was 2/10 before the race and remained 2/10 while I was running. Afterward, it rose to 4/10. That increase belongs in the debrief as surely as the final-kilometre surge does.
The stable in-race symptoms suggest the execution did not trigger an immediate escalation. The post-race response still confirms that this was not a normal, fully healthy performance. Finishing strongly and paying a symptom cost can both be true.
What CoachChat Saw
When CoachChat reviewed the FIT file alongside my race account, its central observation was that I had not spent the early kilometres proving how fast I could run. I had spent them keeping the race alive. When the course finally gave me an opportunity, I finished like a racer.
That assessment works because it combines two kinds of evidence. The data shows the fast final kilometre, late heart-rate peak and rising cadence. My debrief explains why the slow kilometres occurred and why the finish mattered. Either source on its own would tell an incomplete story.
What I Learned From the Blue Nose 10K
- A conservative start is a skill, especially when race-day adrenaline argues for something more exciting.
- A planned walk can protect the whole race. It should not automatically be filed under failure.
- One pace chart cannot explain hills, aid stations, symptoms and deliberate choices.
- A late rise in pace, heart rate and cadence is strong evidence that the finish I remembered was real.
- The post-race symptom response matters when judging whether the day was truly successful.
- A context-heavy race should not be used to predict a clean future 10K time.
Why This Race Belongs in the AI Running Coach Experiment
The Blue Nose 10K happened before my current AI Running Coach Experiment became a formal, ongoing system. That makes it a useful historical anchor.
Future comparisons should not obsess over the raw 1:12:25. More useful markers will be pace and heart-rate relationships on runnable sections, cadence stability, how quickly I resume after planned walk breaks, how much reserve remains late and what the lower leg reports afterward.
In addition, the race also demonstrates why the system needs both sensor data and human testimony. The FIT file alone could make kilometres five and eight look like failures. Memory alone could turn the final kilometre into a heroic feeling unsupported by evidence. Together, they produce something more honest.
The Takeaway
The 2026 Blue Nose 10K was not the marathon I had set out to run, nor was it a clean test of what I could do when healthy and fully trained. It was a demanding 10K managed under real constraints.
I started conservatively and walked when the plan and course called for it. Each time, I resumed running. Then, with one kilometre left, I found a gear that had been waiting all morning.
That is the part I want to carry forward. Not the fantasy that every setback ends with a cinematic finish, but the practical knowledge that restraint can preserve possibility. Sometimes keeping the race alive is what gives you the chance to race at the end.
AI Disclosure
I used ChatGPT, which I call CoachChat, to help organize my debrief and interpret the Garmin FIT data. The observations are based on my records and lived experience. AI can help me ask better questions, but it cannot diagnose an injury or replace an appropriate human professional.
Safety Disclaimer
This is an N=1 account of my own race and recovery. It is not medical advice or a training prescription. Pain, injury history and safe return-to-running decisions are individual. Consult an appropriate qualified professional when symptoms persist, worsen or concern you.