Road to TCS TO Waterfront 42K – 2025
Today was Build Phase 1 / Week 3 / Run 1-a 30-minute Zone 2 easy run. I’ll admit it: my head was already thinking about tomorrow’s time trial. But I reminded myself that every run deserves presence, not just the ones with the word “test” in them. I didn’t do much by way of pre-run fueling-just 500ml of Nuun to hydrate. My intention, as always, was to live in the basement of Zone 2. You can tell me if I succeeded, but subjectively, I felt coasty. (I’m coining that word now.)
The cool 13°C morning definitely helped. I was locked in early and found myself in a rhythm that bordered on autopilot. That said, I did drift a little faster than prescribed at times. A couple of gentle mental nudges helped me pull it back without breaking stride.The real surprise? The run ended sooner than expected. I felt strong. In fact, I’ve been feeling strong quite a lot lately-and while part of me expects it, another part still marvels at the sensation. Maybe fit really does happen when you stay consistent.
📊 Coach’s Corner
Let’s break down the numbers and see what they have to say.
Workout Goal:
30 minutes in low to mid Zone 2 (7:13–7:40 min/km)
Execution Overview:
| Metric | Value |
| Duration | 30:26 |
| Distance | 4.46 km |
| Avg Pace | 6:50/km |
| NGP | 6:47/km |
| rTSS / hrTSS | 45 / 28 |
| IF (pace) / IF (HR) | 0.91 / 0.71 |
| Pa:HR | 6.65% |
| Avg HR | 141 bpm |
| Max HR | 148 bpm |
| Elevation Gain | 94 m |
| Avg Cadence | 165 spm |
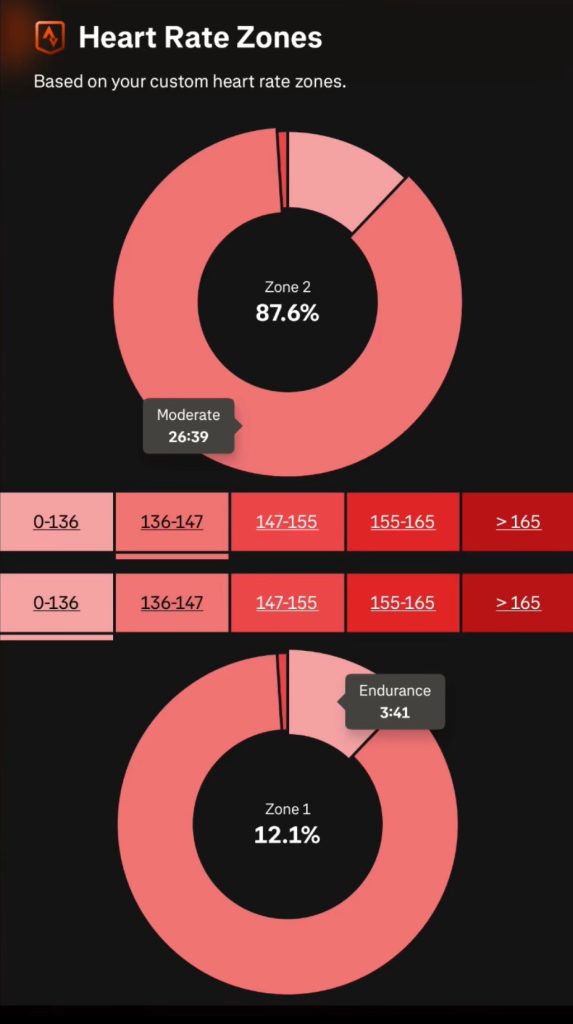
Heart Rate Zones
- Zone 2: 87.6% (26:39)
- Zone 1: 12.1% (3:41)
You executed beautifully. Even though your pace exceeded the prescribed range, your heart rate stayed exactly where it should be-with over 87% of the time spent in Zone 2. A Pa:HR of 6.65% also supports aerobic efficiency. The bump in rTSS vs hrTSS reflects that minor overachieving pace but doesn’t suggest overreaching. Your cadence was solid at 165 spm, and VAM of 185 m/h indicates solid climbing strength.
The IF (HR) of 0.71 shows this stayed well within endurance effort-even if your legs were feeling peppy.
📊 Lap Metrics Deep Dive
So how did the numbers back up how this run felt? Let’s take a closer look at the lap-by-lap data to see what story my watch was telling while I was out there getting it done:
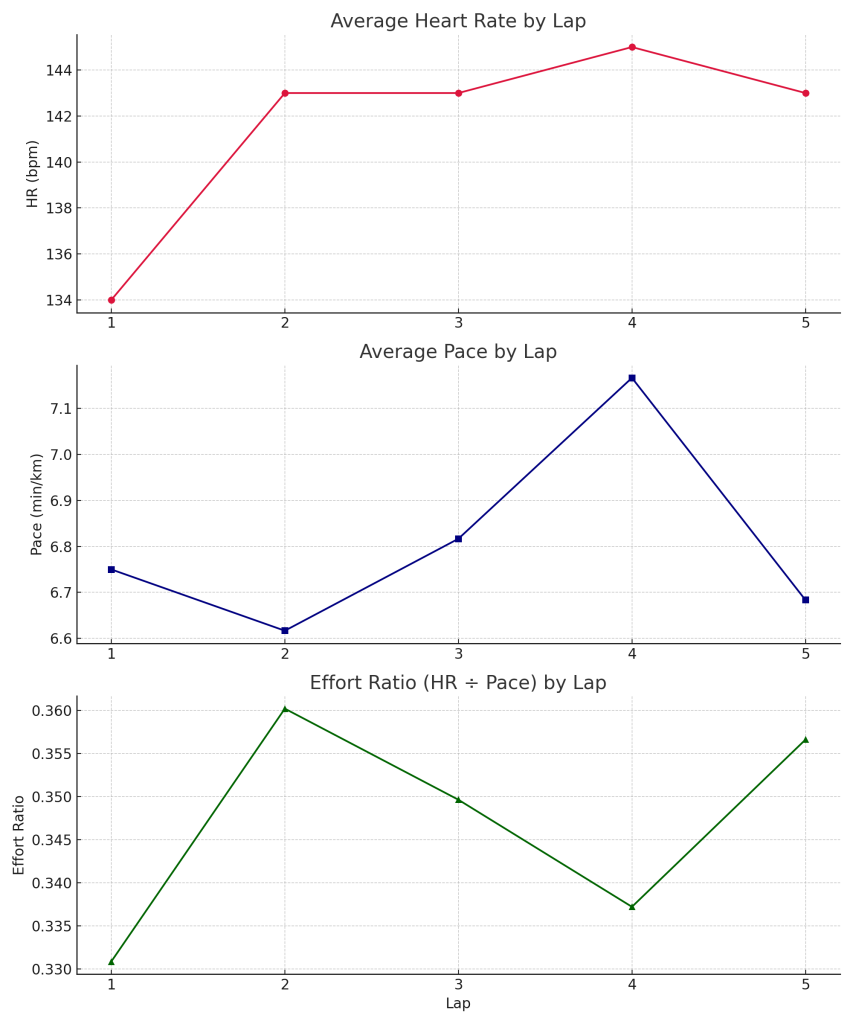
- ❤️ Heart Rate: A gentle upward trend – likely due to cardiac drift, not overexertion.
- 🕐 Pace: Surprisingly even. Less than 15 seconds variance across laps.
- ⚖️ Effort Ratio: HR per unit pace climbed modestly, showing aerobic strain, not overload.
Interpretation:
This data confirms a textbook Zone 2 execution. I stayed within aerobic thresholds while letting my body dictate pace. A solid, formful outing that built aerobic endurance without pushing the redline.
Zone 2 Refresher:
Easy runs target 60–70% of your max HR. They develop endurance and fat-burning efficiency. This type of training is a quiet powerhouse – improving mitochondria, recovery, and longevity without crushing your legs.
🧠 Takeaways
- You respected the spirit of the workout, even with a bit of pace drift.
- That coasty feeling? That’s a byproduct of fitness catching up to effort.
- The run served its purpose without fatiguing you ahead of tomorrow’s time trial.
- This is what Zone 2 mastery looks like.
🧭 Wrapping It Up
Another successful Zone 2 easy run in the books. While my brain wanted to rush ahead to the next workout, my body reminded me to stay present-and rewarded me with flow, strength, and confidence.
One step at a time. That’s how fitness is built.
[…] Related Post: Zone 2 Easy Run – July 22, 2025 🔗 Learn More: What is Threshold Training? […]
[…] 🧊 Zone 2 Easy Run – July 22 […]
[…] 🔗 Read the full post […]