Welcome to your no-jargon, plain-English guide to training metrics.
If you’ve ever scratched your head over abbreviations like IF, TSS, or Pa:HR, you’re in the right place. This page breaks it all down for runners over 50 who want to train smarter, not harder.
Whether you’re a data geek, a curious beginner, or somewhere in between, this guide will help you make sense of the numbers that support your running journey.
🧠 Why Metrics Matter (Especially After 50)
As we age, it becomes more important to train with intention. Balancing stress and recovery helps us stay strong, reduce injury risk, and continue making progress.
Training metrics help you:
- Avoid overtraining
- Measure real improvements
- Train by effort instead of ego
- Recover with purpose
📊 The Big 3: What You’ll See Most Often
1. IF – Intensity Factor
What it is:
A score showing how hard your workout was compared to your threshold pace or heart rate.
Typical values:
- 1.00 = your one-hour race pace
- 0.85–0.95 = controlled endurance or tempo effort
- 1.05+ = hard intervals or racing
In plain language:
IF is your workout effort dial. Higher numbers mean you pushed harder.
🧠 Memory hook: “IF I went harder, I’d blow up.”
2. TSS – Training Stress Score
What it is:
A score that combines how long and how hard you ran. It helps you track overall training load.
Typical values:
- 30–50 TSS = short or easy run
- 60–80 TSS = moderate effort
- 100+ TSS = long run or tough session
In plain language:
TSS is your training points system. It shows how much work your body handled and can guide your recovery needs.
3. Pa:HR – Pace to Heart Rate Ratio
What it is:
A measure of aerobic efficiency. It compares how your pace and heart rate change over a steady run.
What to look for:
- Under 5% = efficient
- Over 5% = either working too hard or slowing down
In plain language:
Pa:HR shows how well your heart and legs are working together. Over time, lower values usually mean improved fitness.
🧠 Memory hook: “Pa:HR = how smartly your body runs the show.”
🧩 Bonus Metric You Might See
CTL – Chronic Training Load
Also known as “Fitness” in some apps, CTL shows your long-term training trend over the past few weeks. It helps you see whether you’re building volume steadily or training too little.
Think: “Am I consistently putting in the work?”
Note: Some metrics like ATL (fatigue) and TSB (freshness) require a TrainingPeaks Premium account. For most runners over 50, sticking with core data like IF, TSS, and Pa:HR is more than enough.
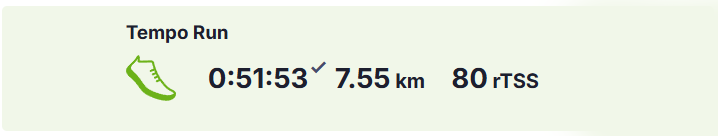
🏃♂️ Real Example: My Tempo Tuesday
Here’s how this plays out in real life from my own training log:
Workout: 3 x 8-minute threshold intervals
Planned IF: 0.90
Actual IF: 0.87 (slightly easier, still effective)
rTSS: 79
hrTSS: 70 (my heart rate was a little lower than expected)
📊 Metrics from a recent tempo run: Heart Rate, Pace, and rTSS visualized.
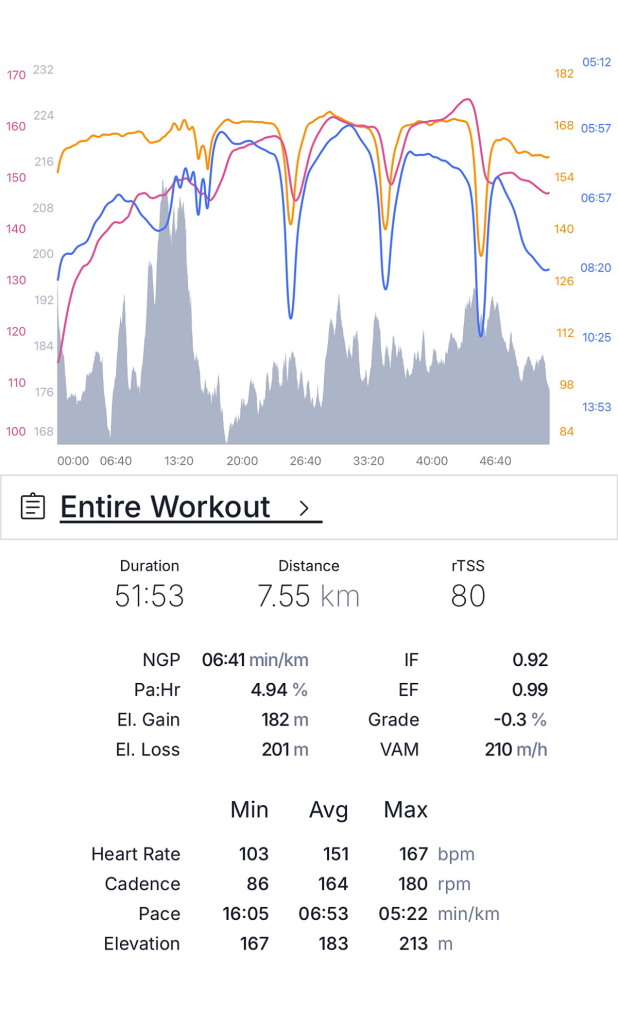
Takeaway: I may be becoming more aerobically efficient, or I was under-fueled that day. Either way, it’s useful feedback.
📥 Coming Soon: Free Download
A printable Training Metrics Cheatsheet for Runners Over 50 is on the way. It will include memory hooks, examples, and plain-language definitions. Keep an eye out.
💬 Final Thought
You don’t have to be a data nerd to benefit from training metrics. These numbers should support your training, not complicate it. When in doubt, listen to your body first and let the data validate your experience.
Because running after 50 isn’t just possible — it’s powerful.